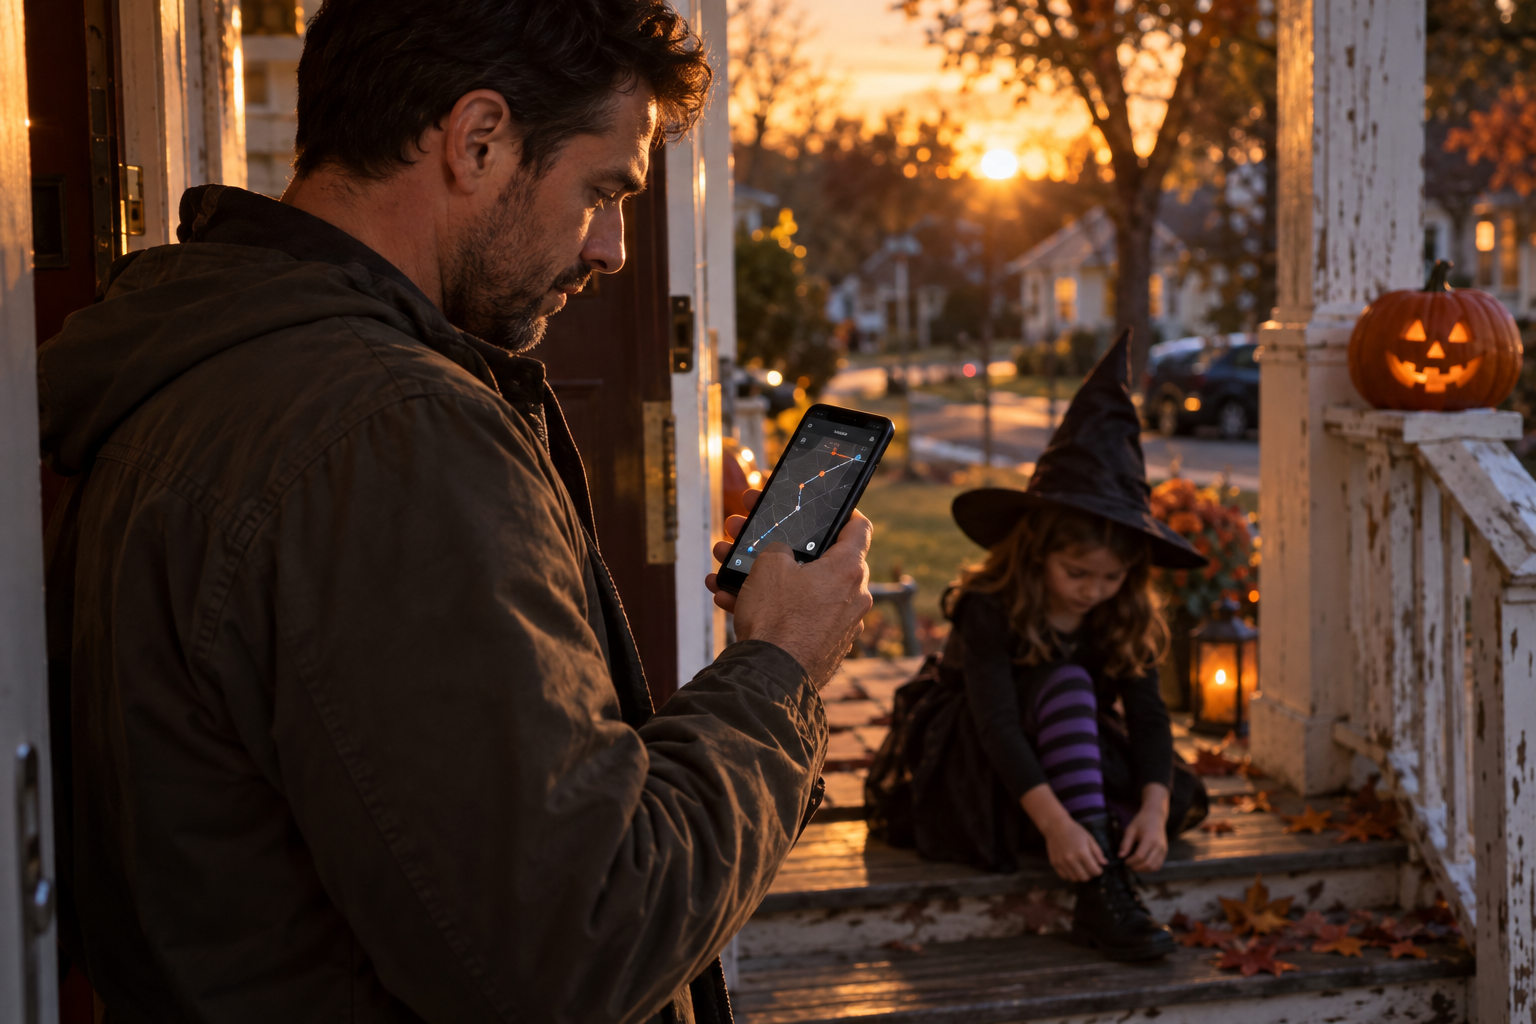
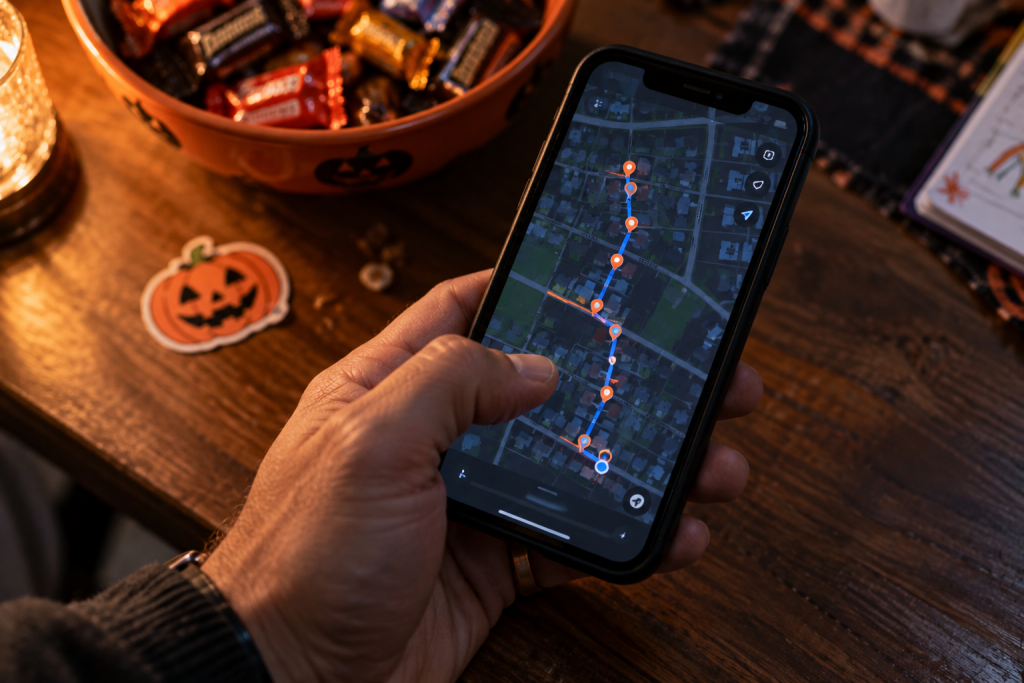
You pull up the route on your phone the week before Halloween. Eight streets to cross between the first house and the last. It feels like useful information, the kind of number a parent can plan around. Fewer crossings, less risk. More crossings, more risk. Simple.
Except it isn’t, and the research behind this article is mostly the story of finding that out.
Why Halloween night is different in the first place
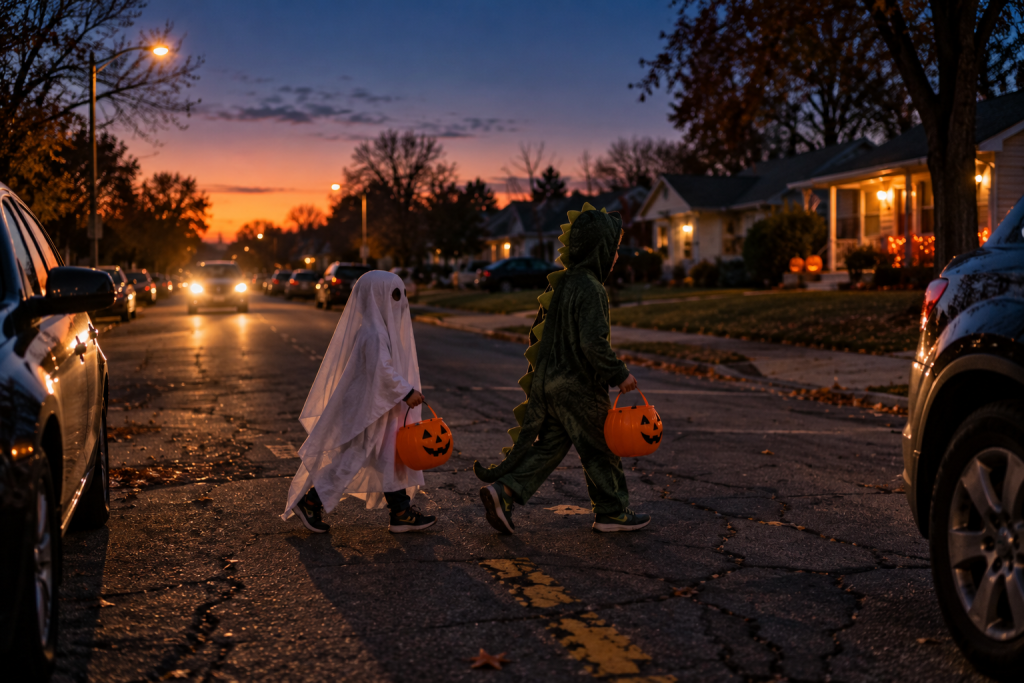
Before any of that, it’s worth being honest about why this question matters at all. A JAMA Pediatrics analysis of U.S. traffic fatality records, covering 42 Halloweens from 1975 through 2016, found 608 pedestrian deaths on Halloween evenings against 851 across the matched control evenings the researchers compared them to — a week before and a week after, same hours.
That works out to a 43% higher risk of a pedestrian fatality on Halloween than on an ordinary evening. For children between 4 and 8 years old specifically, the increase was far larger: a tenfold jump. Risk peaked around 6 p.m., right as trick-or-treating gets underway and daylight runs out.
A separate CDC analysis looked at a different stretch of years — 1975 through 1996 — and compared Halloween deaths against every other evening in that window rather than two matched dates. It found child pedestrian deaths on Halloween running at roughly four times the rate of an ordinary evening, and it flagged the same recurring pattern behind those deaths: darkness, frequent street crossings, children stepping into the road from between parked cars.
At a Glance: Two Different Studies, Not One Number
| Study | Years Covered | Comparison Design | Key Finding |
|---|---|---|---|
| JAMA Pediatrics (Staples, Yip & Redelmeier) | 1975–2016, 42 Halloweens | Halloween evenings vs. matched control evenings (one week before, one week after) | 43% higher pedestrian fatality risk overall; tenfold higher for ages 4–8; risk peaked around 6 p.m. |
| CDC | 1975–1996 | Halloween evenings vs. every other evening in that period | Child pedestrian deaths at roughly four times the ordinary-evening rate |
These are two different studies, measuring two different things, in two different ways. One shouldn’t be read as confirming the other’s exact number, and neither should be treated as interchangeable with a viral “twice as likely” statistic you may have seen elsewhere without a clear source. What they agree on is simpler and more durable: something about Halloween evening changes the odds for a child on foot. Neither one, though, tells you which feature of a specific route is doing that work. That’s the actual subject of this article.
What counting crossings can tell you — and what it can’t
Start with the number itself. Is counting street crossings even a reasonable thing to do?
Yes, as far as it goes. In a Baltimore study, Rao, Hawkins, and Guyer found that children from households without a car or a home of their own crossed an average of 5.4 streets a day, compared with 3.7 for kids whose families had both. Across the areas they studied, pedestrian injury rates were also strongly related to how often children were driven rather than walking. A separate look at exposure and injury by police district found the same basic relationship holding at a larger scale.
At a Glance: Daily Street Crossings by Household Access
| Households without a car or a home of their own | 5.4 street crossings/day (average) |
| Households with both a car and a home of their own | 3.7 street crossings/day (average) |
So crossing count is a real measure of something. It just isn’t a dose. Nothing in the research supports treating each additional crossing as adding a fixed amount of risk, and nothing supports the idea that eight crossings are “twice as dangerous” as four, or dangerous in any specific multiple at all.
The studies behind that 3.7-versus-5.4 comparison were about ordinary daily walking, not Halloween night, and they were never designed to isolate crossing count from everything that travels alongside it — how far a family walks, what kind of neighborhood they’re in, whether a child is usually supervised.
In other words: count the crossings. It’s a real first step. But a number on its own can’t distinguish a quiet residential corner from a busier, faster road with curb parking, and that’s a difference no crossing count can capture.
What each crossing actually asks of your child
Here’s where the research gets more specific — and more useful.
A New Zealand study that compared 190 injured or killed child pedestrians against 380 matched control sites found that the busiest locations had more than fourteen times the odds of child pedestrian injury compared with the quietest ones. Streets with a high density of curb parking had roughly eight times the odds of injury compared with streets with less of it.
And sites where average speeds ran above 40 km/h (about 25 mph) had about 2.7 times the odds of injury compared with slower ones — though, notably, the odds didn’t keep climbing indefinitely as speeds rose further; they leveled off rather than scaling in a straight line.
A separate case-control study from Perth, Australia, comparing 100 injured children against 400 uninjured controls, found that each additional 10,000 vehicles a day on a child’s most-crossed street was associated with about 12% higher odds of injury. It also found that a visual obstruction on the street’s edge — something blocking a clear view between the sidewalk and the road — was associated with more than 2.5 times the odds of injury.
A third study, this one in a Southern California county, found that the highest category of parked-vehicle exposure was associated with nearly ten times the odds of child pedestrian injury compared with the lowest.
At a Glance: Three Studies, Same Kinds of Variables
| Study | Traffic Volume | Curb Parking / Visual Obstruction | Vehicle Speed |
|---|---|---|---|
| Auckland, New Zealand | More than 14x the odds (busiest vs. quietest sites) | Roughly 8x the odds (high density of curb parking vs. less) | About 2.7x the odds (>40 km/h vs. slower; odds leveled off at higher speeds) |
| Perth, Australia | About 12% higher odds per additional 10,000 vehicles/day | More than 2.5x the odds (visual obstruction at street’s edge) | — |
| Southern California county | — | Nearly 10x the odds (highest vs. lowest parked-vehicle exposure category) | — |
Across these studies, the same kinds of variables keep appearing: traffic conditions, vehicle speed, and whether parked cars or other obstructions limit the view.
None of these numbers is a Halloween-specific risk multiplier, and none of them should be treated as a formula you can apply to your own street. They’re associations from specific studies of specific places.
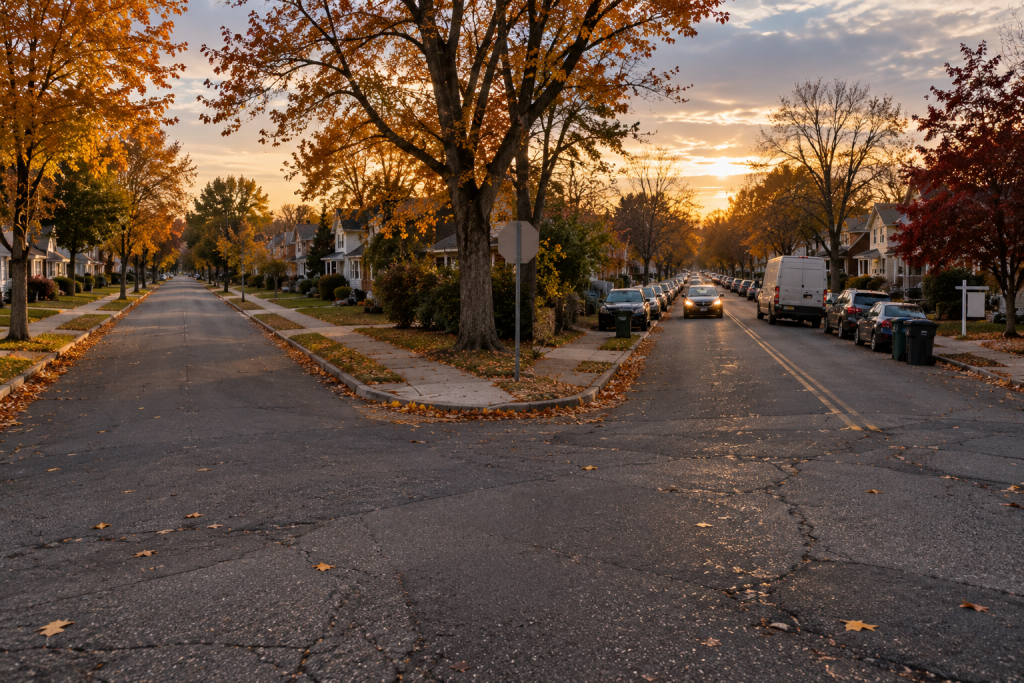
But taken together, they say something a crossing count alone never could: two routes with exactly the same number of crossings can put a child into very different traffic environments. Eight crossings on quiet residential streets with clear sightlines is not the same decision as four crossings that include one busier, faster road with cars parked along both curbs.
Speed is really two different questions
Speed deserves its own pause here, because it shows up twice in this research, answering two different questions that shouldn’t get merged into one.
The first question is what speed looked like in the traffic environments where child pedestrian injuries occurred. In the Auckland study, sites with mean vehicle speeds above 40 km/h were associated with higher odds of child pedestrian injury than slower sites.
The second question is different: if a pedestrian is struck, how does impact speed relate to injury severity? A 2025 analysis by Monfort and Mueller found the average risk of a serious or fatal injury climbing steeply with impact speed: about 18% at 20 mph, 32% at 25 mph, 67% at 35 mph, 90% at 45 mph, and 97% at 55 mph.
At a Glance: Impact Speed and Injury Severity (Monfort & Mueller)
| 20 mph | About 18% average risk of serious or fatal injury |
| 25 mph | About 32% |
| 35 mph | About 67% |
| 45 mph | About 90% |
| 55 mph | About 97% |
That’s a severity curve, describing what happens once a collision has already occurred — not a statement about how likely one is to happen in the first place — and the two shouldn’t be added together or quoted as if they were the same statistic.
The problem you can’t see coming
Parked cars and roadside obstructions turn up so often in this research that it’s worth pausing on why, exactly, they matter — because the honest answer is more interesting than “cars block the view.”
The most obvious version of the problem sits with the driver: a parked vehicle can obstruct a driver’s view of a child approaching or entering the road. That visibility problem sits alongside the repeated associations with curb parking and visual obstructions found across child pedestrian studies in different countries. But it isn’t the whole picture, and treating it as the whole picture would just turn this into a rerun of the costume-visibility question this series already covered elsewhere — a driver problem, full stop.
A study that’s easy to overlook, because it doesn’t involve crash data at all, asked something different: do children themselves recognize when a crossing point is a bad one? Demetre and Gaffin gave children ages 6, 8, and 10 a simple choice — a crossing spot boxed in by vehicles that blocked the view of the road, or one with a clear line of sight to approaching traffic.
At age 6, the choice was close to a coin flip; the kids in the study didn’t reliably prefer the clear-view option. By 8, and more clearly by 10, a preference for the clear-view spot had emerged — and that shift tracked closely with how much experience a child already had getting around as a pedestrian on their own, not just with age alone.
At a Glance: A Preference That Develops With Age (Demetre & Gaffin)
| Age 6 | Close to a coin flip — no reliable preference between occluded and clear-view crossing points |
| Age 8 | A preference for the clear-view spot begins to emerge |
| Age 10 | A clearer preference for the clear-view spot, tracking with independent walking experience |
That’s a different kind of risk than a driver’s blind spot. It suggests that for a younger child, or one who hasn’t done much independent walking yet, the danger isn’t only that a parked car hides them from traffic.
In fact, the parked car may also be hiding the danger of that spot from the child — not because the child is careless, but because recognizing a bad crossing point is a skill that’s still developing.
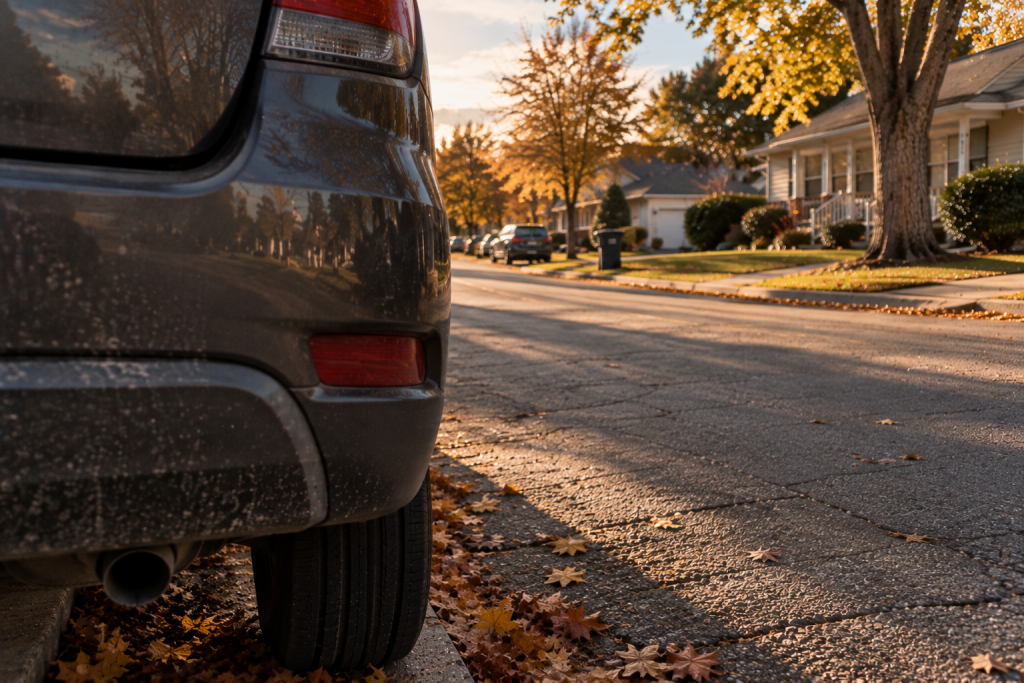
Nothing in this research tells you at what exact age a child reliably notices this on their own; it only tells you that the pattern shifted clearly between 6 and 10. And that pattern doesn’t settle the question either way: the study doesn’t establish an age when a child is safe to cross alone, and it doesn’t show that a 6-year-old is incapable of recognizing an obstructed view, or that a 10-year-old can safely judge every traffic situation. That gap is still worth a parent’s attention on Halloween night.
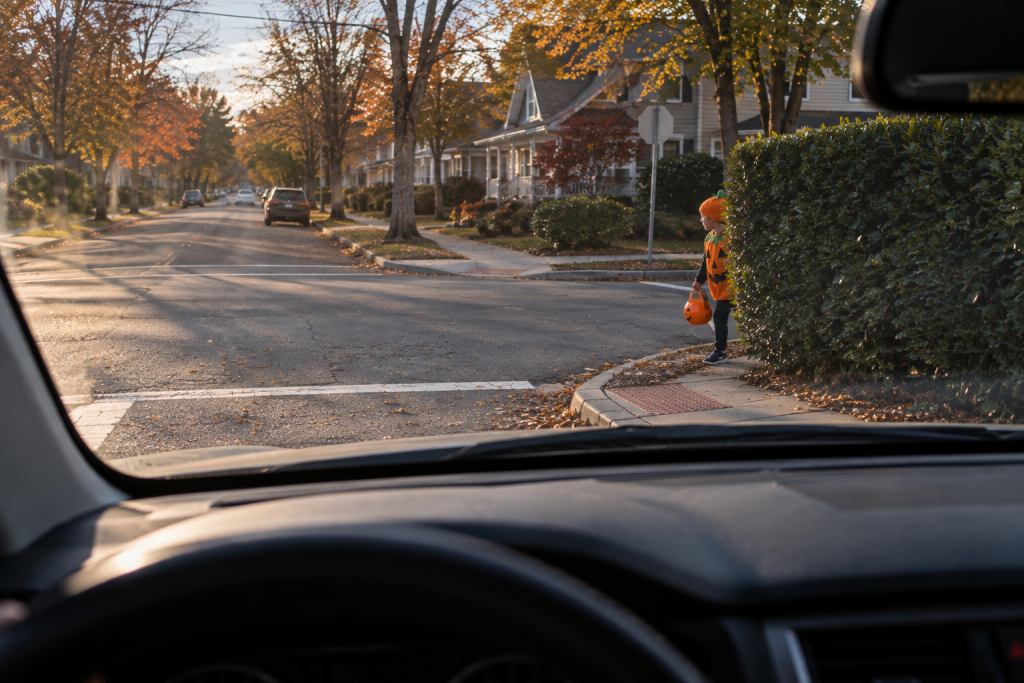
Put together, these findings let us look at the same crossing from three directions. Can the driver see the child? That’s the familiar question. Can the child see approaching traffic? That’s what the Auckland and Perth visual-obstruction findings speak to. And there’s a third question, easier to miss than either: does the child recognize that the crossing itself is limiting what they can see?
A parked car or a hedge can affect all three at once, and stopping at the first of them leaves the other two unexamined.
Where on the street matters too, cautiously
American Academy of Pediatrics guidance still recommends using a corner or marked crosswalk rather than crossing midblock when there’s a good alternative. That’s sensible guidance. But the research doesn’t support turning it into another formula: different studies measure different populations and crossing situations, and they don’t establish that every intersection is safer than every midblock crossing.
How to actually use this before Halloween
None of this adds up to a number you can calculate for your own street, and nothing here should turn into a “Halloween route risk score.” What it adds up to instead is a better set of questions than “how many crossings does this route have.”
Count the crossings first — that part’s still worth doing. Then walk the route, or picture it block by block. Stand where your child would stand. Then look. How much traffic actually moves through here, and how fast? What’s parked or planted along the curb that might block a clear view? Would my child, standing right at this spot, be able to see a car coming — and would a driver approaching this spot have a clear view of them? And, for a younger child especially: does this look like an obvious place to be careful, or is it exactly the kind of spot that looks fine until you’re standing in it?
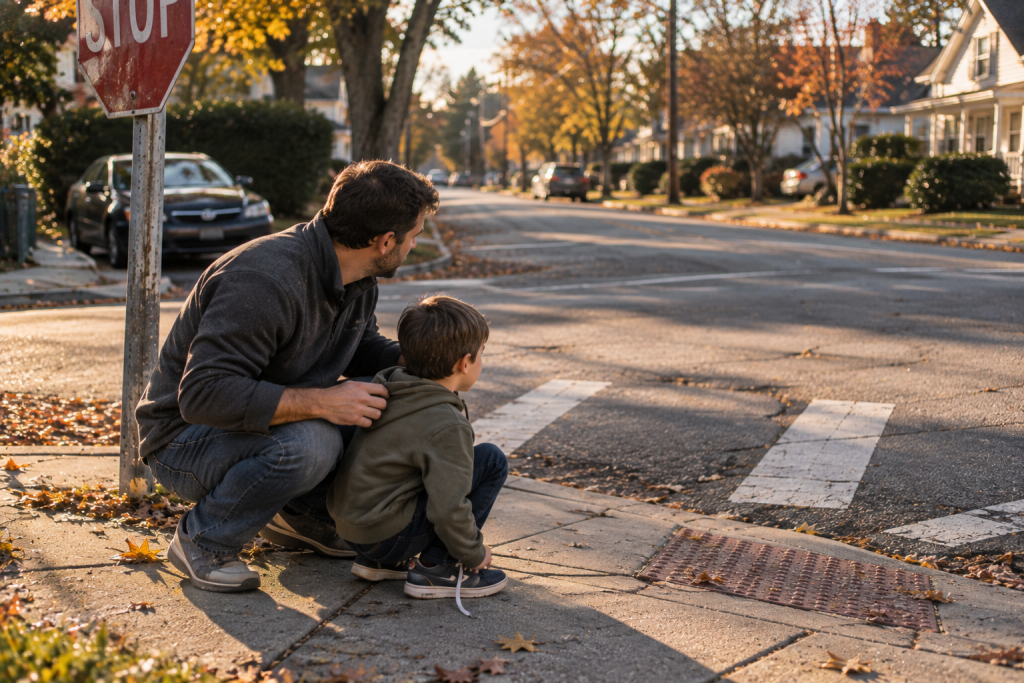
That last question is easy to underestimate. An adult may glance at a street lined with parked cars and immediately think, don’t cross there. A child may need help learning to notice the same problem.
What this isn’t
This isn’t a replacement for anything this series has already said about making a child visible after dark — reflective materials, lights, colors that stand out against a streetlight. That’s still real, and it still matters. This article is about a different piece of the same evening: not whether a driver can recognize your child once they’re in view, but what determines whether driver and child get a fair chance to see each other in the first place, and whether your child has the experience yet to spot a bad crossing on their own.
Both pieces are true at once. Neither one makes the other optional.
Back to the map
So: eight street crossings. Still worth knowing. But now, hopefully, it’s the start of the question rather than the answer to it. Walk those eight, or picture them, and ask what each one is actually asking of your child — how much traffic, how fast, what’s in the way, and whether your child would know to be careful there even if you weren’t the one saying so.
Count the crossings. Then inspect the crossings.
Sources
- Staples JA, Yip J, Redelmeier DA (2019). Pedestrian Fatalities Associated With Halloween in the United States. JAMA Pediatrics, 173(1):101-103. Link.
- Centers for Disease Control and Prevention (1997). Childhood Pedestrian Deaths During Halloween — United States, 1975-1996. MMWR. Link.
- Rao R, Hawkins M, Guyer B (1997). Children’s exposure to traffic and risk of pedestrian injury in an urban setting. Bulletin of the New York Academy of Medicine, 74(1):65-80. Link.
- Roberts I, Norton R, Jackson R, Dunn R, Hassall I (1995). Effect of environmental factors on risk of injury of child pedestrians by motor vehicles: a case-control study. BMJ, 310:91-94. Link.
- Stevenson M, Jamrozik K, Burton P (1996). A case-control study of childhood pedestrian injuries in Perth, Western Australia. Journal of Epidemiology and Community Health, 50(3):280-287. Link.
- Agran PF, Winn DG, Anderson CL, Tran C, Del Valle CP (1996). The role of the physical and traffic environment in child pedestrian injuries. Pediatrics, 98(6):1096-1103. Link.
- Monfort SS, Mueller BC (2025). A modern injury risk curve for pedestrian injury in the United States: the combined effects of impact speed and vehicle front-end height. Journal of Safety Research (via IIHS). Link.
- Demetre JD, Gaffin S (1994). The salience of occluding vehicles to child pedestrians. British Journal of Educational Psychology, 64:243-251. Link.
- American Academy of Pediatrics / HealthyChildren.org. Pedestrian Safety Tips for Families. Link.

Comments
One response to “Your Halloween Route Has Eight Crossings. The Number Matters — Just Not the Way You Think.”
[…] can fully watch a dog, a child, and a street crossing at once. (For crossings, see our guide to Halloween street crossings; for visibility, our guide to Halloween costume […]